Figures for the Oxford submission

Return to the interactive map

Figure 1

Figure 1: regional setting and verified local occurrences

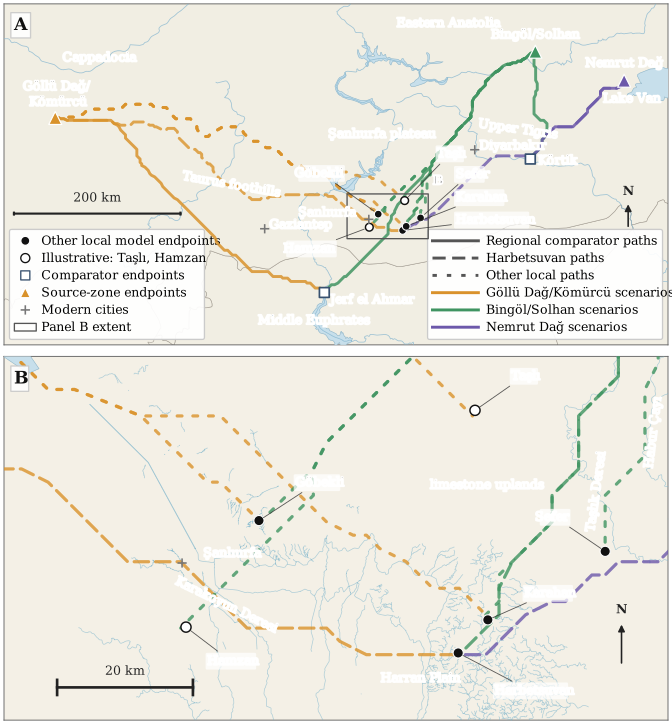
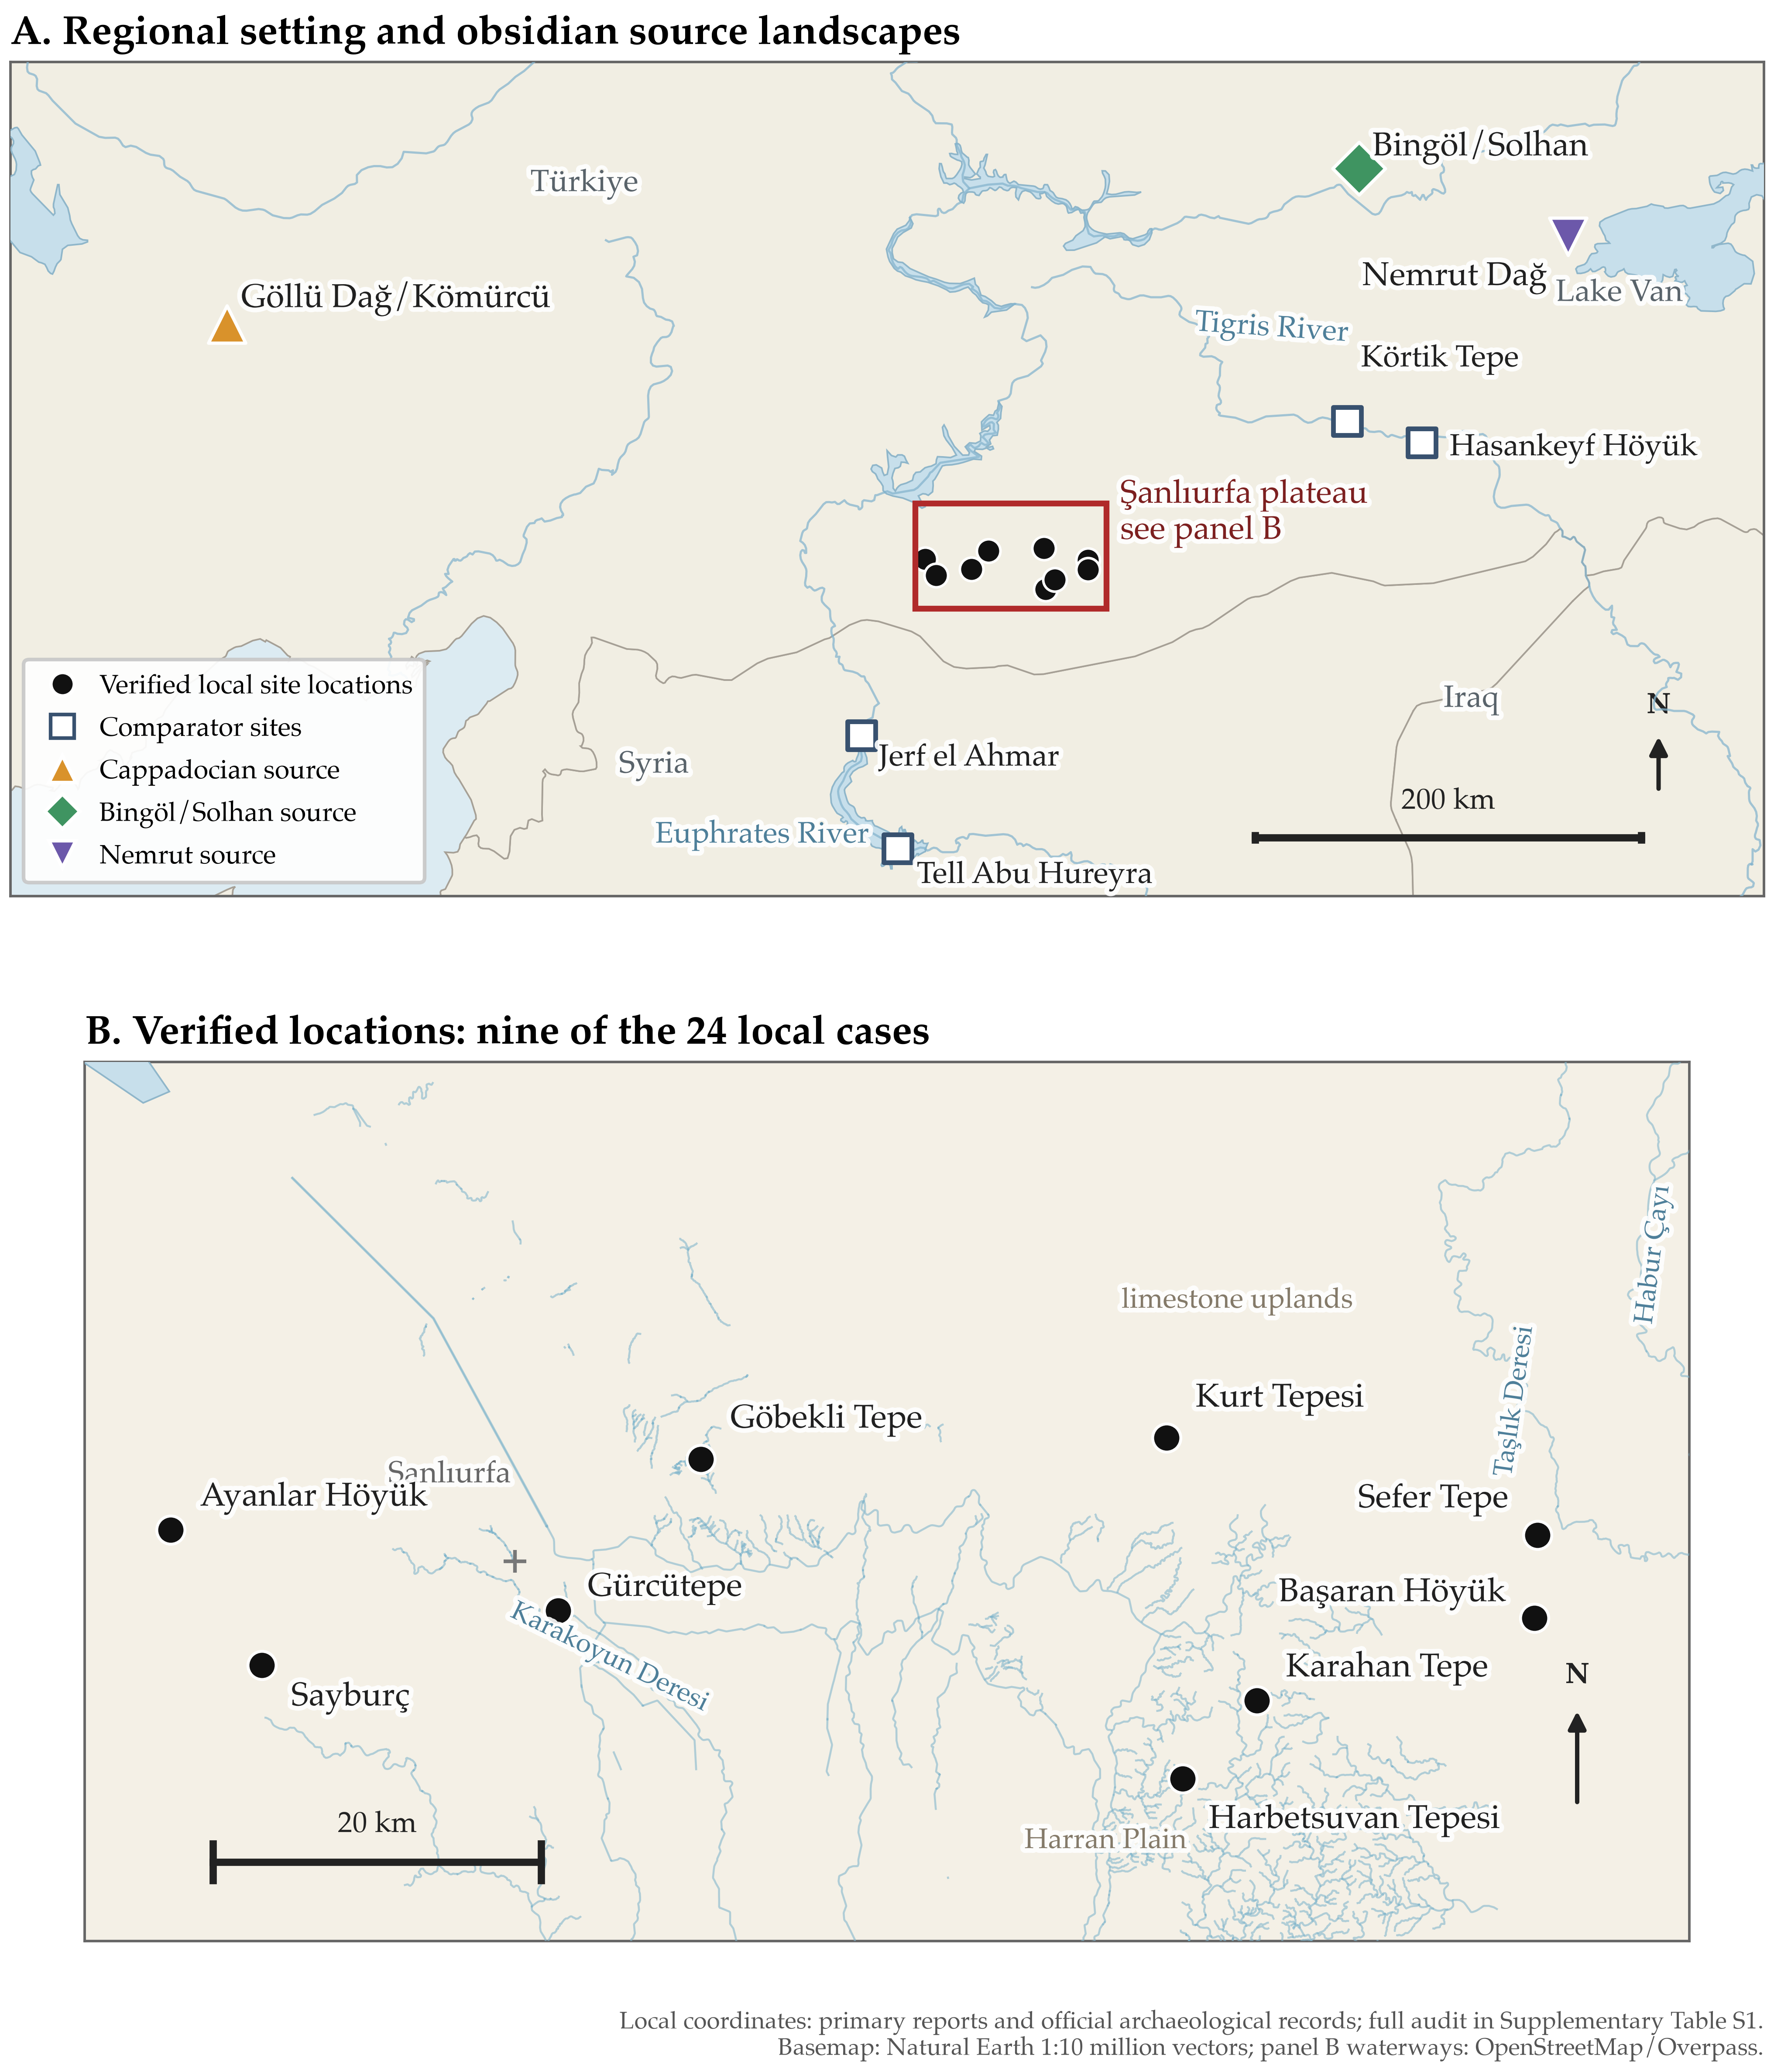
Figure 1. Regional setting and verified locations of local obsidian occurrences. (A) The Şanlıurfa plateau in relation to three representative Anatolian source-zone endpoints and four Upper Tigris and Middle Euphrates comparators. Source symbols represent points within source landscapes, not their full geological extent. The red box marks the area enlarged in panel B. (B) Nine localities with independently verified coordinates from the 24-case evidence register. The other 15 are listed in Table 1 and Supplementary Table S1 but are not mapped because their coordinates are insufficiently secure. Filled circles mark local occurrences, open squares comparators and coloured symbols source endpoints; these symbols do not rank archaeological evidence. Local coordinates come from primary publications, the UNESCO nomination record and the Şanlıurfa Governorship’s cultural atlas, with precision and limitations documented in Table S1 and the coordinate audit. Basemap: Natural Earth 1:10 million vector data (Natural Earth n.d.); local waterways: OpenStreetMap via Overpass (Olbricht and Overpass API contributors n.d.; OpenStreetMap contributors n.d.).
PNG · PDF · SVG

Figure 2

Figure 2: regional least-cost paths and enlarged local view

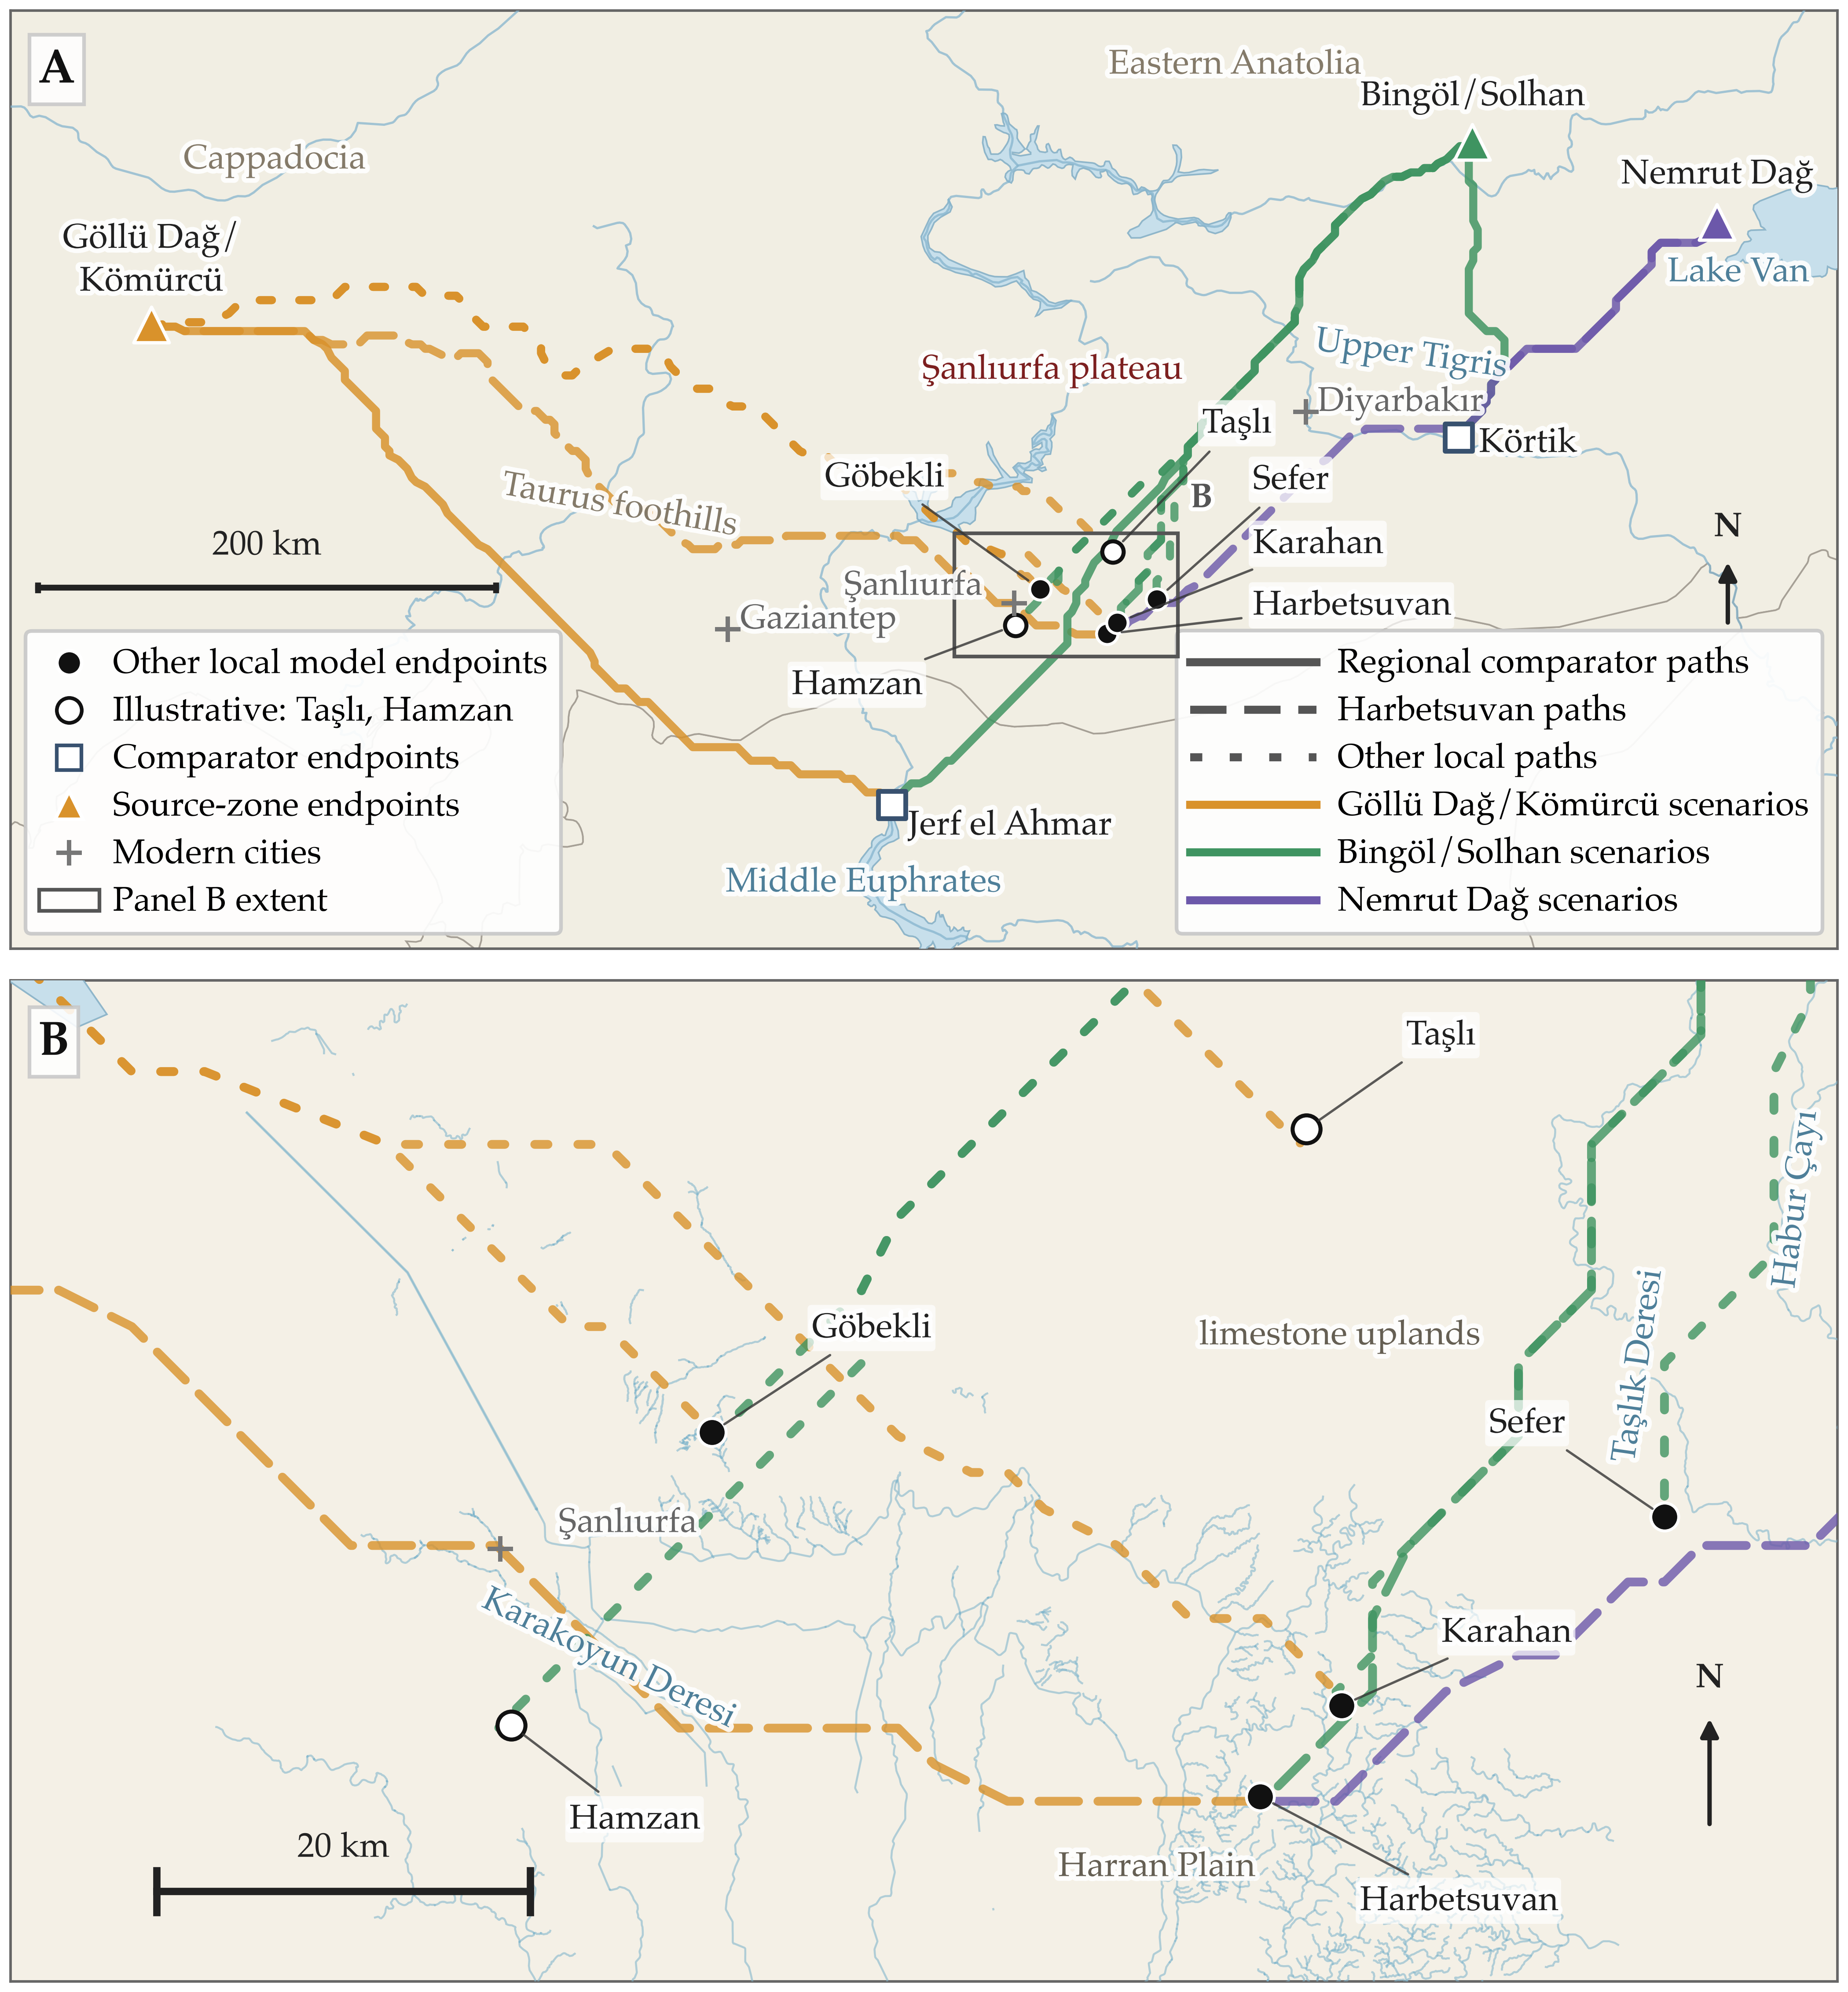
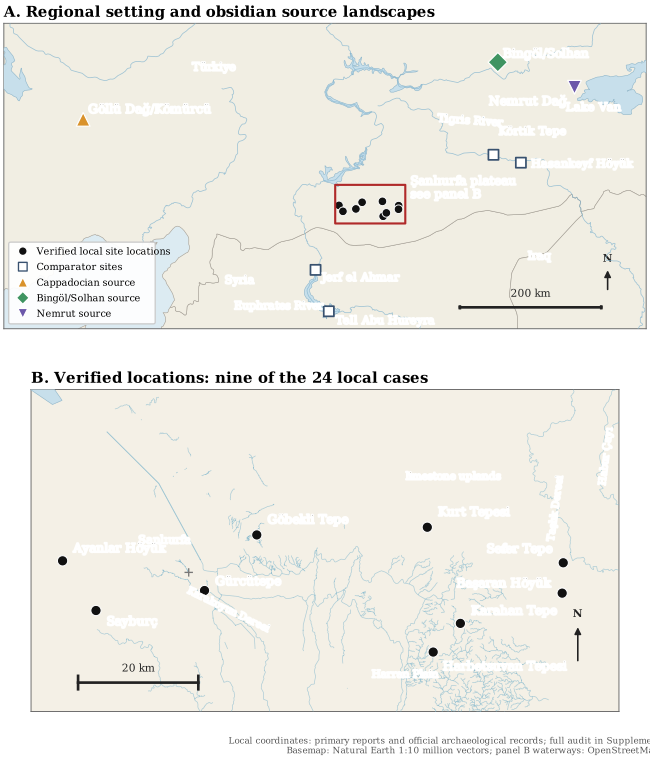
Figure 2. Selected least-cost path scenarios. (A) Fourteen of the 22 calculated paths connect three representative source-zone endpoints to six local endpoints and two regional comparators, Körtik Tepe and Jerf el Ahmar. These comprise seven principal, three supplementary local and four regional comparator paths. The omitted Nemrut Dağ–Karahan and Nemrut Dağ–Göbekli principal paths are reported in Tables 2 and S2. (B) Enlargement of the local segments of the ten paths to Şanlıurfa-area destinations; the box in A marks the extent shown. Some paths overlap. Orange, green and purple identify Göllü Dağ/Kömürcü, Bingöl/Solhan and Nemrut Dağ scenarios, respectively. Solid lines mark regional comparator paths, long-dashed lines paths to Harbetsuvan, and short-dashed lines paths to the other local destinations. Filled circles mark Harbetsuvan, Karahan, Göbekli and Sefer; open circles mark illustrative Taşlı and Hamzan endpoints; open squares mark comparators, triangles source-zone endpoints and grey crosses modern cities. Endpoints retain the original model coordinates; coordinate sources and verification status are documented in Table S1. Display lines are simplified; analytical path lengths include full grid paths and endpoint connectors (Table S2). The paths establish neither source attribution nor travelled routes, and their intersections do not identify transfer points. Blue rivers and lakes provide modern geographical context, not reconstructed Early Holocene waterways. Boat travel and the feasibility of river and lake crossings are not modelled. Geographical layers: Natural Earth and OpenStreetMap via Overpass. Elevation data used for modelling: Mapzen Terrarium tiles.

PNG · PDF · SVG